Drips
All of the figures below are constructed with contorted
continued fractions. The figures below have not
been generated by iterating a function. These figures
are not Poincare maps, even though they look like they are.
That, in fact is the point.
The full, mathematical depths of the work below is plumbed elsewhere,
on the Gap Theory page.
But we should take a moment to introduce it anyway.
Given a rational r between 0 and 1, it can be expressed as
a continued fraction:
r = 1 / (a1 + 1 / (a2 + 1 / (a3 + ...)))
This expression can be easily manipulated; this page shows
expressions involving
w = 1 / (a1 + z1 / (a2 + z2 / (a3 + ...)))
where the z's are assorted functions of sine and cosine.
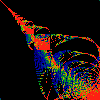
 Csn
This shows a scatterplot of (x,y) pairs, with the x's & y's
coming from continued fractions, with z of the i'th term being
(1+cos(omega*i)) or (1+sin(omega*i)) respectively.
All values of omega between 0.0 and 2*pi are equally represented,
and account for the cyclic structures. The omega=0.0 values
lie roughly on the diagonal.
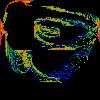
 Cycle
This shows a single "cycle" of the above, with r ranging
from 1/2 to 2/3. Note that all rationals in this range have a
one in the first two terms of thier continued fraction expansion.
In this, and all of the pictures, the colors represent the
"measure": how often a small region (pixel) is visited by
the function. Black=never, blue=rarely, green=sometimes,
red=often.
 Far Cycle
As above, except that the arguments to sine and cosine are not
i*omega, but f(i*omega), where f is the farey number mapping, and omega
ranges from 0.0 to 2 Pi.
 Fnu
As above, except that the arguments to sine and cosine are not
f(i*omega), but 2*pi*f(i*nu), where f is the farey number mapping, and
nu ranges from 0.0 to 1.0.
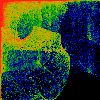
 Three Far
As above, except that the arguments to sine and cosine are not
2*pi*f(i*nu), but 2*pi*f(3^i *nu), where 3^i is 3 raised to the i'th power.
Note that although the derivative of the farey map vanishes at all
rationals, it's appearent slope is greatest near 1/3 and 2/3's (and
the map is the flatest near 0, 1 and 1/2). The powers-of-three
scaling used to generate this figure pairs the most rapidly changing
parts of the farey map to the flatest, resulting in the "loops"
evident in this figure.
Note that the figure appears to almost tile
... but not quite. Note other suggestive horizontal and vertical
edges.
 Far Omega
As above, except that the arguments to sine and cosine are not
2*pi*f(3^i *nu), but f(3^i * 2*pi * nu).
Irates
The "deconvergent"
c(i) = 1 / (a(i+1) + z(i+1) / (a(i+2) + z(i+2) / (a(i+3) + ...)))
gives us yet another quantity to play with.
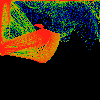
 Rat
Just as in all of the figures above, this is a scatterplot of cosines
vs. sines. This time, though, c(i) is used:
z(i) = 1.0 + cosine (2*pi*nu*c(i))   for the x coords, and
z(i) = 1.0 +  sine  (2*pi*nu*c(i))   for the y coords.
 Flip Rat
As above, but
z(i) = 1.0 + cosine (2*pi*nu/c(i))   for the x coords, and
z(i) = 1.0 +  sine  (2*pi*nu/c(i))   for the y coords.
Algorithm Notes
Here is a quickie description of the algorithm used to generate
the figures above:
DrawDrips () {
   for (int j=0; j < N; j++) {
      float r = j/N;
      ContunuedFrac c = ComputeContinuedFracOfReal (r);
      float x = MangledContinuedFrac (c, cosine);
      float y = MangledContinuedFrac (c, sine);

      AssignColor (r);
      DrawPoint (x,y);
   }
}
A detailed presentation of the algorithms is presented on the
Gap Theory page.
Copyright (c) 1996, 1997 Linas Vepstas

The Drip Drop Room
by Linas Vepstas is licensed under a
Creative Commons
Attribution-ShareAlike 4.0 International License.
 Csn
This shows a scatterplot of (x,y) pairs, with the x's & y's
coming from continued fractions, with z of the i'th term being
(1+cos(omega*i)) or (1+sin(omega*i)) respectively.
All values of omega between 0.0 and 2*pi are equally represented,
and account for the cyclic structures. The omega=0.0 values
lie roughly on the diagonal.


