Mandelbrot Bud Maths
We know that the buds that sprout off of the main Mandelbrot Cardiod
sprout at locations connected to Farey Numbers. The proportionate sizes
of these buds seem to be suggested by the sorts of gaps that one sees in
transformations of continued fractions. But can any exact results be given?
Not that I know of, but here's what I know of so far.
Note that this page is devoted to the shapes of buds in the complex
parameter plane. There is an entirly different way to talk about 'bud
sizes', and that is in terms of the arc-lengths and arc-angles of
parameter rays. The parameter-ray (Douady-Hubbard) theory is
fairly complete and encompassing, and provides a considerable
insight into many M-set properties.
The Parameter Ray Atlas
page provides links to the theory and some of its results.
The shape of the main Mandelbrot cardiod is given by the formula
z = eit/2 - e2it/4 . The largest bud, the west bud,
appears at t=2*pi/2. The next largest, the north bud, is at t=2*pi/3,
and so on, each at t=2*pi/n.
This perl script prints out bud locations
for the first twelve buds.
In fact, the importance of Fibonacci Numbers and Farey Numbers for the
description of the Mandelbrot set is well known.
(See, for example, R.L. Devaney,
How to Count)
We can use this to make
a first cut at guessing the size vs. location of buds by plotting the size
of the gaps in a continued fraction expansion:
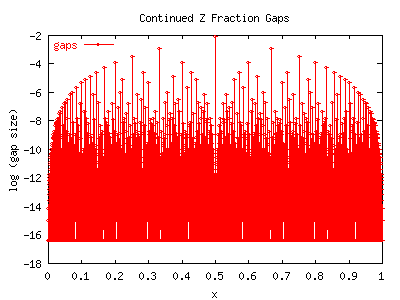
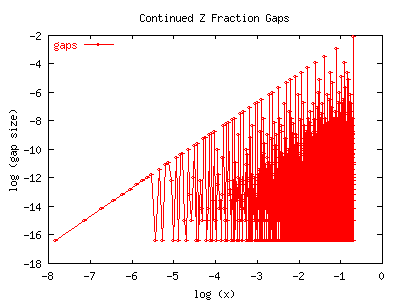
The derivation of the above function is given on the
Gap Theory page.
G-(x) has the nice property that the sizes of the gaps
exactly follow the ranking of the Farey tree.
If you examine the graphs closely, you can see that
the largest sequence of gaps occurs at values of 1/n,
(with a gap size of 1/n2). The next sequence occurs at the
Farey mediants of the previous sequence: (2/5, 2/7, 2/9, 2/11, etc)
The gaps in these sequence are also proportionately smaller, just as
are the second-sequence of buds in the Mandelbrot set.
(In fact, G-(p/q)=1/q2 whenever p/q has been reduced to
have no common factors; the Farey ordering follows from this.)
This property is crucial:
Given any rational number, the gap at that number provides a reasonable
predictor of the size of the corresponding bud on the Mandelbrot set.
However, the prediction is not good enough.
The next graph shows the experimentally measured sizes of the 'main sequence'
of buds along the Mandelbrot set. Its a log-log graph. The bud sizes are
multiplied by n2/2, which is the gap power law. It can be seen that
the diameters continue to fall off faster than that, and that they don't seem to
obey a power law.
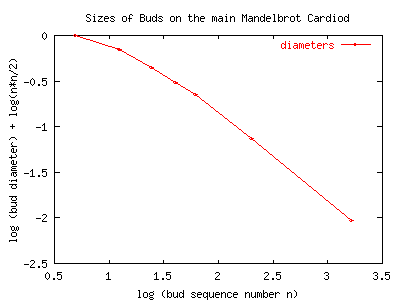
The graph is of the data from this table. The bud centers and diameters are
experimentally determined. We took considerable care
to measure the bud diameters to 6 or so decimal places. Later on, we will discover
that the buds aren't exactly circular, so the 'diameter' is ill-defined.
What we've measured is the width, from east to west, for buds 5 and above. For bud
3, we measured the hieght, and for bud 4, along the diamter that is perpendicular to
the cardiod (at 45 degrees).
The horn locations are
trivially computed from the cardiod equation. Go figure.
| n |
bud center x |
bud center y
| bud diameter
| horn x
| horn y
|
|
| 2 | -1.00000 | 0.000000 | 0.500000 | -0.75000 | 0.000000
|
| 3 | -0.12500 | 0.744500 | 0.18890765 | -0.12500 | 0.6495190528
|
| 4 | 0.281000 | 0.531000 | 0.0878623 | 0.250000 | 0.500000
|
| 5 | 0.379000 | 0.336000 | 0.047346 | 0.3567627458 | 0.3285819451
|
| 6 | 0.389000 | 0.216500 | 0.0282463 | 0.375000 | 0.2165063509
|
| 10 | 0.329800 | 0.054300 | 0.0064209 | 0.3272542485 | 0.0561284970
|
| 25 | 0.265290 | 0.003710 | 0.0004203 | 0.2652149105 | 0.0039065250
|
| 52 | 0.25362301 | 0.00041746 | 0.0000467 | 0.25361898 | 0.00043942
|
| 101 | 0.25096561 | 0.00005710 | 0.000006374 | 0.25096533 | 0.00006013
|
| 200 | 0.250246619 | 0.000007343 | 0.000000814 | 0.25024660 | 0.00000775
|
Well, lets figure that maybe there is some sort of conformal magic that is throwing
things off. Lets start doing some guesstimating. The buds get small as they
approach the scorpions tail. Plotting |z-1/4| on a log-log graph shows the right
behavior, wrong slope, by two. Turns out that a pretty darn good estimator for the
radius of the buds on the main sequence is |z-1/4|1/2/n2 !!
This perl script computes this quantity. It looks very
good for the first 5 or so buds, but by bud 10, its prediction is too small by
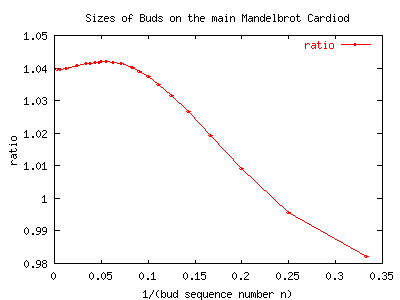
about 5%. Surprisingly, the prediction remains off by about this much up to at
least bud 200, as shown by the graph below. This graph plots the ratio of the
experimental bud size to the predicted size.
(high precision data here)
Note that |z-1/4|1/2 = sin (t/2) where t is the same parameter used
to parameterize the cardiod. The radius of the circle tangent to the cardiod
is R = 2 sin (t/2) / 3. The center of the tangent circle is at
z0 = (eit+e2it/2)/6.
A little bit of experimental work confirms that
the second sequence of buds, at 2/3, 2/5, 2/7, 2/9, etc. also roughly follows the
conjectured formula: the bud at x=2/(2n+1) has a
radius r(x) = sin(pi*x) * G-(x). Or, expressed
as integers, for positive n, the radius rn=sin(pi*2/(2n+1)) /
(2n+1)2. One can now start guessing big-time, and discover that
ones guesses are on the spot.
It might help visually to see what's going on when the cardiod is unrolled to a
flat line. The Self-Similar page will help
with a visual exploration of what's happening here.
The Big Result
Here is the big result: given any ratio p/q which has been reduced so that
p and q have no common factors, then there is a bud on the main cardiod,
located at z = eit/2 - e2it/4 with t=2*pi*p/q.
The radius of the bud is about 5%-10% larger than sin(pi*p/q)/q2.
Oblong
By this point, it also becomes clear that the buds are not quite circular;
they seem slightly squashed, again, by a factor of about 5%.
 Here's a picture
of the 200'th bud in the main sequence located at (0.2502466166 0.0000073574).
The width of this image is 0.00000083, which is about 7% larger than the predicted
bud diameter of 0.0000007854. We can see that the bud is clearly a bit wider
than it is tall. Barely, though. By fine tuning, most of the visual effect goes
away. This example is almost a fooler: the buds are out of round by very very
tiny amounts.
The easiest way to see that the buds aren't quite round is by examining bud 6.
Its western edge is at (0.375 0.2165063509) and the tangent to the cardiod
at that point is exactly, precisely vertical.
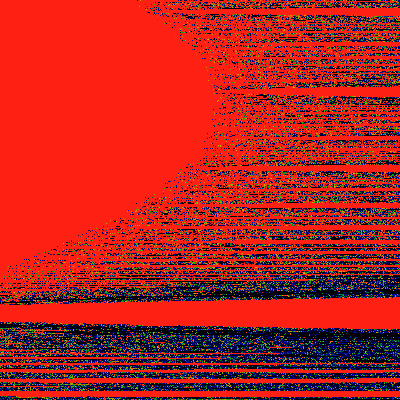 Therefore, we would expect the eastern-most limb of this bud to
be due-east. Its not. Its just a hair higher, at about (0.4032463 0.21658)
Compared to the bud diameter, it is out of round by about 1/3 of a percent,
or about 1 pixel in a 400 pixel-wide image. This would not be visible to the
naked eye. The image below shows the eastern limb. The center of the image
lies at [0.4032463 0.2165063509]. The width of the image is 0.000001 but the
height is only 0.0003, which is why everything is very, very squashed vertically.
If the limb was exactly due east, then the bulge in the image should be exactly
in the middle. Its not: it has crept upwards. Ergo, the bud is not exactly
circular.
Go figure.
Well, here's a figure of the variation in radius of the 3-cycle bud at (-0.125,
0.7445). The red points are the measured data, the green points are the hand-fit.
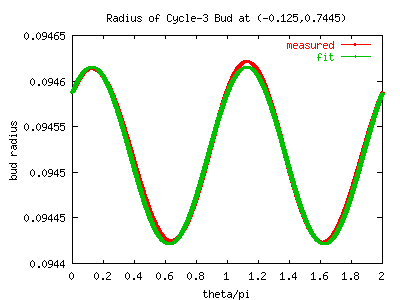
The bud is almost exactly an ellipse. The green line, a good fit to the radius,
is given by
r(t) = 0.094520 + 0.000096 cos (2t - pi/4)
r(t) = 0.0944214 (1 + 0.0041092 sin2 (t + 3pi/8))1/2
That is, the ellipse parameters are:
RMajor = 0.094621
RMinor = 0.094422
phi0 = pi/8
The bud is centered at
x0 = -0.12486683 = -0.125 + 0.00013317
y0 = 0.7439684
That is, the boundary of this bud seems to be
z = x+iy = x0 + i y0 + r(t) * eit
= x0 + i y0
+ RMajor cos (phi-phi0)
+ i RMinor sin (phi-phi0)
where the elliptical paramter is related to the real angle t by
phi = arctan ( (RMajor / RMinor) tan (t))
Just how good is the fit?
A careful look at the above graph will make it clear that the ellipse itself is
slightly egg-shaped. How egg-shaped?
The next image shows the fit subtracted from the raw data.
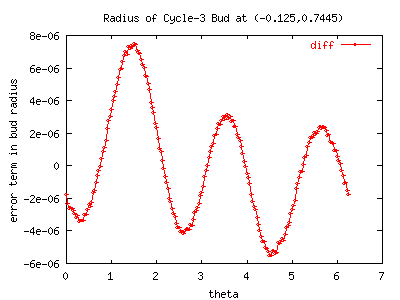
Clearly, there is a rather distinct additional eccentricity.
A quickie eyeball says the shape is like
e3i phi + pi/4 .
One can try to do Fourrier analysis on the data, but some work seems to indicate
that Fourrier is not the best method of decomposition. In particular, the
'egg-shaped-ness' of the thing introduces some low frequency Fourrier componenents
(e.g. at e2i phi) that arguably 'don't belong', and wouldn't be there
with other decompositions. (Note also, fourrier decomposition on elliptical
coordinates introduces some numerical/theoretical problems, as the ellipse radii
are specified a-priori.)
Go figure.
Other buds along the main sequence behave qualitatively very similarly.
They all seem to be very close to being ellipses, with the non-elliptical
e3i phi term being about two orders of magnitude smaller than
the e2i phi.
The table below
lists the raw data for the measured paramters.
Note that along the main sequence, points in the nth bud converge to an n-cycle.
The formula that is used to fit the radii is
r(t) = ravg + recc cos (2t - p0)
We've made an effort to quote only the meaningful significant digits: i.e. the
error in these numbers consists mostly of an uncertainty in the last digit.
The angles are also measured, but they seem to fall so closely to simple fractions
of pi that we quote the nearest simple fraction, instead of a decimal value.
We use rguess = sin(pi/n)/n2 as the first order guess for the bud
radius. See also the size.dat datafile for additional data.
| n |
xc |
yc |
ravg
| ravg/rguess
| recc
| p0
| recc/ravg
|
|
| 2 | -1.00000 | 0.000000 | 0.250000 | 1.0 | 0.0 | - | 0.0
|
| 3 | -0.124866818 | 0.74396884 | 0.09452088 | 0.9822898 | 9.8999e-5 | pi/4 | 0.001047
|
| 4 | 0.281058181 | 0.531069896 | 0.043999991 | 0.9956061 | 7.167e-5 | -pi/2 | 0.001629
|
| 5 | 0.37926948 | 0.33593786 | 0.0237270 | 1.009149 | 5.52e-5 | -7pi/8 | 0.002319
|
| 6 | 0.38912506 | 0.216548077 | 0.01415882 | 1.019441 | 4.196e-5 | -9pi/8 or -37pi/32 | 0.002964
|
| 7 | 0.376222674 | 0.145200726 | 0.00909100 | 1.026678 | 3.171e-5 | ? | 0.003487
|
| 8 | 0.35924728 | 0.101225755 | 0.00616879 | 1.031669 | 2.4111e-5 | ? | 0.003908
|
| 9 | 0.34339510 | 0.073032700 | 0.00437060 | 1.035082 | 1.8589e-5 | ? | 0.004253
|
| 10 | 0.32985010 | 0.054264593 | 0.00320580 | 1.037419 | 1.4503e-5 | 3pi/8 | 0.004524
|
| 11 | 0.31860462 | 0.0413441289 | 0.002419144 | 1.038987 | 1.1480e-5 | ? | 0.00491
|
| 12 | 0.30933816 | 0.032184347 | 0.001869337 | 1.040049 | 9.182e-6 | ? | 0.005163
|
| 16 | 0.285606908 | 0.013910243 | 0.000793887 | 1.041748 | 4.211e-6 | ? | 0.005304
|
| 20 | 0.273460776 | 0.007201761 | 0.000407463 | 1.041875 | 2.252e-6 | ? | 0.005527
|
| 40 | 0.2560922544 | 0.0009136416 | 5.10344e-5 | 1.040733 | 2.948e-7 | ? | 0.005776
|
| 80 | 0.2515373728 | 0.0001146270 | 6.37952e-6 | 1.039967 | 3.702e-8 | ? | 0.005803
|
| 160 | 0.2503852370 | 0.0000143415 | 7.97387e-7 | 1.039698 | 4.657e-9 | ? | 0.005840
|
| 320 | ? | ? | 9.96713e-8 | 1.039626 | 5.811e-10 | ? | 0.005830
|
Notes & Bibliography
Assorted notes & bibliography.
Copyright (c) 2000 Linas Vepstas

Mandelbrot Bud Maths
by Linas Vepstas is licensed under a
Creative Commons
Attribution-ShareAlike 4.0 International License.
To contact Linas, see his
Home Page.


 Here's a picture
of the 200'th bud in the main sequence located at (0.2502466166 0.0000073574).
The width of this image is 0.00000083, which is about 7% larger than the predicted
bud diameter of 0.0000007854. We can see that the bud is clearly a bit wider
than it is tall. Barely, though. By fine tuning, most of the visual effect goes
away. This example is almost a fooler: the buds are out of round by very very
tiny amounts.
 Therefore, we would expect the eastern-most limb of this bud to
be due-east. Its not. Its just a hair higher, at about (0.4032463 0.21658)
Compared to the bud diameter, it is out of round by about 1/3 of a percent,
or about 1 pixel in a 400 pixel-wide image. This would not be visible to the
naked eye. The image below shows the eastern limb. The center of the image
lies at [0.4032463 0.2165063509]. The width of the image is 0.000001 but the
height is only 0.0003, which is why everything is very, very squashed vertically.
If the limb was exactly due east, then the bulge in the image should be exactly
in the middle. Its not: it has crept upwards. Ergo, the bud is not exactly
circular.


